What if.. I told you that this mathematical model can tell you, which of your email marketing ideas are genius?
Mathematics is a fantastic but difficult thing. If you have ever seen the movie Moneyball, with Brad Pitt, then you must also have had the feeling that formulas, metrics and equations can explain things that we, as humans, have great difficulty unravelling ourselves. When math is done right, it enables us to easily test out hypotheses by doing complex calculations on future scenarios – quickly. If you are not a sabermetrician like Bill James (the man who began designing the baseball math), then don’t worry. I have done the calculations and build a calculator that will enable you to work with your own hypotheses.
Just imagine some of the scenarios explained below. They are all developed by a set of neat ideas, good thoughts and important questions, but require a complex mathematical model to truly answer.

Frequency hypotheses
How often should we email our subscribers? How much and in what should we invest our resources to get the best and most lucrative outcome from our email marketing? Imagine this: Today your company has a monthly budget (mostly based on employee wages and software expenses) of $1200. Based on this budget the current aim is to send out two monthly newsletters that get a 40% open rate and a 10% click rate.
Create your hypotheses
Would it be better to send three monthly (worse) emails that only get 35% open rate and 8% click rate?
Would it be better to increase the budget by 50% to send that one additional email?
Would it be better to double the budget to simply double the number of emails (we assume that the average click rate will decrease to 9% and the web conversion rate from mail decrease to 4,5%)?
Would it be better to invest $15K to automate some systems that allow the team to stay on the same budget but send three emails a month?
By the term “better” we are strictly referring to “would make more money”. I have never met or read anyone who has a way of easily answering those questions. I built a mathematical model for calculating, testing and analysing your email marketing setup in my startup. You can read a more thorough account of the model later in the post.
Additional status quo information
This model cannot tell you how the world works. However, if you have an idea of how the world works, it can tell you which of your thoughts are the best ones!
Given this information:
10.000 existing permissions
800 new permissions per month
1,5% increase in new permissions per month
Unsubscribe rate is 0,5% per email
A natural 1,17% per month die-rate of emails
0,08% inflation per month
2% alternate monthly rate (discounting rate)
5% sales conversion rate from email traffic
Average order value of $80
50% margin on product
Which of the four hypothesis we created together do you expect to be the most lucrative over the next year? Next three years? Next five years?
Even if you are a mathematical genius who can perform multiple discounted cash flows in your head in a matter of minutes, this question requires a model:
When we use the mentioned model, we can calculate the monetary outcome of each hypothesis. This is the output of the model in one year, three years and five years:
| Profits | Status quo | H1 | H2 | H3 | H4 |
|----------------------|------------|--------|---------|---------|---------|
| Short-term: 1 Year | 9.485 | 10.086 | 13.498 | 8.966 | 2.875 |
| Medium-term: 3 Years | 48.253 | 47.963 | 66.304 | 53.794 | 64.800 |
| Long-term: 5 Years | 97.797 | 94.759 | 132.331 | 112.985 | 136.606 |
In both the short- and medium- run the 2nd hypothesis, where you increase the budget to send an extra monthly email, would be the most lucrative. However, in the long run, the 4th hypothesis, where you invest 15K today to automate the process and thereby be able to send one additional email per month, would win your company the most money.
Perform several iterative experiments
What if you combined the 2nd and 4th hypothesis and do both?
| Profits | Status quo | H2 | H4 | H2 + H4 |
|-----------------|------------|---------|---------|---------|
| Short: 1 Year | 9.485 | 13.498 | 2.875 | 6.429 |
| Medium: 3 Years | 48.253 | 66.304 | 64.800 | 79.447 |
| Long: 5 Years | 97.797 | 132.331 | 136.606 | 163.724 |
The 2nd hypothesis is still the best in the short run, but in the medium- and long run it would be highly beneficial to execute on both the 2nd and 4th hypothesis.
Performing the one-time investment of the 4th hypothesis and the continuous increase in the monthly budget of the 2nd hypothesis would increase profits in present value from around 98K to around 164K – a huge gain in earnings.
Money is worth less in the future than it is today. Money can be invested and thereby yield a return. Furthermore, inflation will make money worth less every year. This aspect of financial email marketing planning (called discounting) is important, especially in the medium and long run.
How to use the calculator
You can find the calculator right here, and make your own copy by clicking “File” then “Make a copy” and save a version of the Sheet to your own Google drive.
Below you can see how the calculator works. Input current “status quo” metrics in the first column and add “changes” in the hypothesis columns and watch the numbers change as you go.
What’s the point?
The mathematical model is on point. But that alone does by no mean secure a valid test of our hypotheses. Although the math is objectively true, the inputs are subjective and biased. Questions like, how much does our click rate drop if we only spent half the time producing a great email? Or how much would our open rate drop if we sent out commercial newsletters once a week instead of once a month? Those are delicate and unpredictable questions. They will vary from company to company and be estimated differently from marketer to marketer. But the real world outcome doesn’t matter in decision making. Let me explain:
If you believe that your company’s open rate will decrease by 20% from 40% to 32% if you change your newsletter frequency from 2 times a month to 4 times a month, there is a way to calculate if that outcome is desirable – before running the actual real-world experiment. I genuinely believe, however, that validating our intuitions can be valuable. As Henri Poincare, one of the foundation builders of chaos theory said in The Foundations of Science: It is far better to foresee even without certainty than not to foresee at all. Knowing and understanding the positive or negative consequences of experimenting with the different variables of email marketing like open rate, frequency or click rates can help everyone make better business decisions moving forward.
Important considerations
Discount rate
One of the main variables in a discounted cash flow is the discount rate. The discount rate is the return you expect on your investments, ROI (in this case per month).
How do you know what discount rate to use? A good start for someone new to financial models like this one is to ask yourself “how much is our company expecting to grow this year”?
Let’s pretend the answer to that question is 30%. Remember to not simply divide this yearly growth by 12 (30%/12 = 2,5%) to get it in months. Due to compound interest, a monthly growth of 2,5% is actually a yearly growth of 35%.
To easily calculate a reasonable monthly discount rate do this: (1+\[forecasted/budgeted yearly growth in decimals\])^(1/12)-1
Then you would get a monthly rate of (1+0,25)^(1/12)-1 = 0,0188 = 1,88%
So a monthly growth rate of 1,88% is equal to 25% yearly growth rate.
Short-, medium- or long-term investments
How far into the future do you want to plan? There is a big discrepancy between investing for short- and long-term gains. So, you should consider what time frame makes the most sense for your company. Furthermore, this decision should be nested on the numbers. You might not want to lose money next year in order to make 20K more over the next 5 years. However, it would be entirely different if you had to take a short-term loss to realize an extra 500K over the next 5 years.
Hypotheses to play with
Would it be lucrative to invest X today to increase the permission growth from Y to Z?
Would it be lucrative to invest X today in automating processes that allow you to increase your email frequency by Y emails per month?
Would it be lucrative to ask for a budget raise of X to improve the quality of every email and thereby increase click rates by Y percent?
Would it be lucrative to invest X today to increase the flow of new permissions per month from Y to Z?
You can also use the model to ask a different set of questions:
How much does the open rate have to increase for us to break even on a budget increase?
How much should the amount of monthly permission increase to make it worthwhile our resources to create so-called content upgrades for these six popular blog posts?
Collecting the pieces
To sum up, I believe that forecasting, test, calculating and validating our ideas and hypotheses before we do real-life experiments is super, super valuable. This mathematical model should hopefully empower you to think harder about the tough questions in data-driven marketing and validate you and your team’s email ideas in the future.
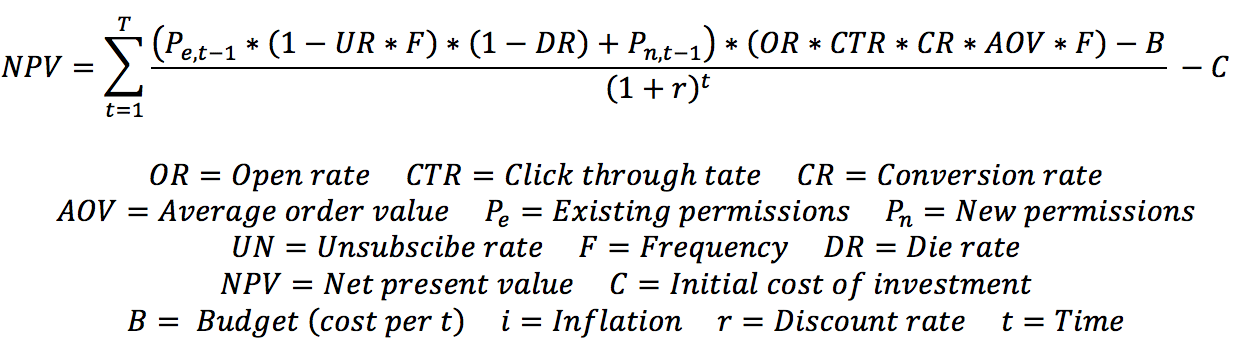
The mathematical model behind
I love this part, but most of you do not want to read this. So feel free to skip this part about the underlying math.
The open rate is a measure of how many percent (in decimals) that open the average promotional e-mail. Click through rate is a measure of how many percent (in decimals) that click their way from the email to the website or webshop. Conversion rate is the rate that you convert people from newsletters and emails to customers once they reach your website. Average order value is, as you guessed, the average order value, however, only from the traffic you get form your newsletters or email.
Existing permissions is the amount of permissions you have today. New permissions is the amount of new permissions you get per month (or whichever t-period you want to use). Permission growth is the percent (in decimals) that your amount of new permissions grow with month over month. The unsubscribe rate is how many percent of your total permissions you typically lose per email you send to your list.
Frequency is the amount of emails per month, t. The die rate is how quickly people change emails, and therefore by default bounce from your list. Most of the experts I have talked to on estimate around 15% per year, which is why you should probably just keep the 1,17% per month.
Net present value is how much money you will make in todays worth. So if you use your next best marketing channel as the discount rate, then you will typically find the NPV to be significant lower than if you use the rate for borrowing money, as the discount rate.
Initial cost of investments represents the amount of money you will invest today to either keep status quo or inflict a change.
Budget represents the monthly cost of the department sending emails, software fees and so forth. Inflation is a metric for how much prices increase year over year.
Discount rate, might be the most difficult to explain. Lets image you put $100 in a portfolio of stocks today – then you might have $161 in 5 years (10% growth per year). If this is your “alternate” use of your money then you want to know if you should, instead, spend your money on email marketing.
Unknowns
The math is correct, however, nobody knows how much the open rate, click rate or conversion rate will drop if you double your frequency. So, we do not know how they all the variables are internally correlated, but we can make qualified guesses and that is exactly the point of economics models.
Model assumptions
You can either create a quite complex model that includes pretty much very variable, like this on, and then you don’t have to rely as much on assumption. On the other hand, you can create a simpler model, but then it would require more assumptions. Say you wanted unsubscribe rate to be a function of frequency. It might be an exponential function, a linear or whatever, but the higher the frequency the higher the unsubscribe rate. However, in this model you can actually decide more variables for yourself – that is cool. Coolness comes at a price, because you need to think harder. If you increase frequency from 2 to 4 then what might happen? Your budget might increase, unsubscribe rate might increase, open rates might drop, click rates might drop and conversion rate might drop? We don’t know for sure but you need to consider the other variables as you test your hypotheses.
The biggest weakness
Not every email you send it promotional/commercial. You might have an anti-churn or re-engage automation flow that is not at all about selling products. Where do you input those emails? Well you don’t, because they don’t effect your cash flow directly. However, if you believe that investing 100K in an re-engage flow will increase open rates of commercial emails by 20% then that is a feasible hypothesis to match up against other initiatives. Simply add 100K to initial investment and increase open rate by 20% of the 2 commercial emails per month you have. Good marketers will not rely on email newsletters but have smarter and more segmented flows. However, this still offers a way to test and validate ideas quickly.
This article was orginally postet on Christians personal website: christianhojbo.com.